Debugging tools budget
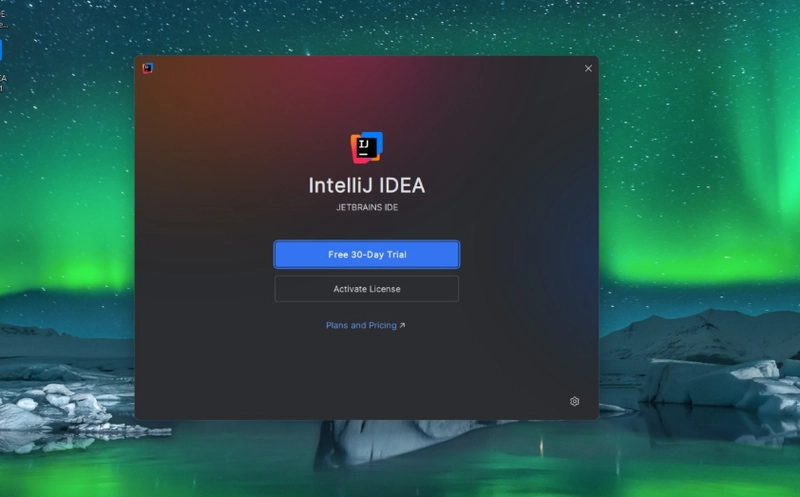
Debugging tools range from free, open-source utilities to enterprise-grade platforms with steep subscription fees. The "best" tool depends less on raw features and more on your team’s workflow and budget constraints. Free tools like Visual Studio Code with the C/C++ extension or JetBrains’ free IntelliJ IDEA Community Edition offer powerful AI-assisted debugging without recurring costs. For larger teams, tools like Datadog or New Relic provide comprehensive observability but come with per-host or per-user pricing that can scale quickly.
When evaluating cost, consider the total cost of ownership. A cheaper tool might require more manual configuration or lack integrations with your existing CI/CD pipeline, leading to hidden productivity losses. Conversely, a premium tool might reduce debugging time significantly, paying for itself through faster resolution times. Always request demos and trial periods to test the AI’s accuracy in your specific codebase before committing to a subscription.


As an Amazon Associate, we may earn from qualifying purchases.
The tradeoff often lies in specialization. Niche AI debugging tools may offer superior accuracy for specific languages or frameworks but lack the versatility of broader platforms. If your team works primarily in Python, a tool like PyCharm Professional might be more cost-effective than a general-purpose observability suite. Evaluate your primary pain points—whether it’s memory leaks, race conditions, or complex logic errors—and choose a tool that addresses those directly. This targeted approach ensures you get the most value from your investment.
Shortlist real options
The debugging landscape has shifted from standalone command-line utilities to integrated AI assistants. While traditional tools like GDB and Chrome DevTools remain foundational, the 2026 standard prioritizes tools that can interpret code context, suggest fixes, and automate repetitive checks. Choosing the right option depends on whether you need deep system-level inspection or rapid application-level error resolution.
We evaluated these tools based on AI integration depth, language support, and ease of setup. The following comparison highlights the strongest contenders for developers looking to replace manual code review with intelligent assistance.
| Tool | Primary Focus | AI Capabilities | Best For |
|---|---|---|---|
| Visual Studio Code | General Development | GitHub Copilot integration for inline debugging suggestions | Full-stack web development |
| Chrome DevTools | Browser Performance | Basic AI-driven network and memory leak detection | Frontend engineers and UI debugging |
| WinDbg | System-Level | AI-assisted crash dump analysis and symbol resolution | Windows kernel and driver debugging |
| PyCharm Debugger | Python Ecosystem | Intelligent code completion and error prediction | Data science and Python applications |
Inspect the expensive parts
Manual code review is often a guessing game. You spend hours scanning lines of code that may not contain the bug. AI-powered debuggers shift that effort. They don't just highlight syntax errors; they analyze execution paths to find where logic breaks. This section outlines the critical points to inspect when evaluating these tools.
1. Crash dump analysis speed
When an application crashes, the stack trace is your first clue. Traditional tools like WinDbg require manual parsing of memory dumps. Modern AI debuggers automate this correlation. Look for tools that instantly map raw memory addresses to source code lines. Speed here matters because every minute spent parsing dumps is time lost from development. A good tool reduces post-mortem analysis from hours to seconds.
2. Silent logic failure detection
Not all bugs crash your app. Many cause subtle data corruption or incorrect calculations. Basic linters miss these entirely. Advanced AI tools track data flow across functions to spot inconsistent states. They flag variables that change unexpectedly or loops that terminate incorrectly. This capability turns invisible failures into visible alerts, saving you from shipping broken features.
3. Context-aware code suggestions
Generic AI assistants suggest fixes based on broad patterns. Debugging-specific tools use your project's context. They understand your framework version, library dependencies, and existing code style. When they suggest a fix, it should integrate seamlessly without introducing new conflicts. This precision reduces the time you spend reviewing and accepting proposed changes.
4. Integration with your CI/CD pipeline
Debugging tools are only useful if they run automatically. Check how the tool integrates with your build pipeline. It should run on every pull request, analyzing code for potential issues before it merges. Look for clear, actionable reports that developers can act on immediately. If the tool requires complex setup or manual triggers, it will likely be ignored.

As an Amazon Associate, we may earn from qualifying purchases.
These tools transform debugging from a reactive chore into a proactive habit. By focusing on these four areas, you can identify which solutions offer the most value for your specific workflow.
Plan for ownership costs
The sticker price of an AI debugging tool is only the entry fee. The real expense comes from integration, maintenance, and the hidden time spent keeping the tool useful. A cheap monthly subscription can become a costly liability if it creates friction in your workflow or requires constant manual oversight.
The integration tax
Most AI tools don't work out of the box. They require configuration to understand your codebase, linting rules, and deployment pipelines. This setup time is often underestimated. If a tool requires significant engineering hours to integrate, its "low cost" is quickly negated by the salary of the developer who built the integration.
Maintenance surprises
AI models and APIs change frequently. A tool that works perfectly today may break tomorrow if the underlying model updates or if your codebase evolves in a way the tool doesn't recognize. You need to budget time for regular reviews, updates, and potentially switching tools as the market shifts. This ongoing maintenance is a silent cost that many teams ignore until it becomes a crisis.
When cheap stops being cheap
A tool is not cheap if it reduces your team's velocity. If developers spend more time correcting AI-generated false positives than they would debugging manually, the tool has failed. The best debugging tools feel invisible—they catch errors without adding steps to your workflow. Always evaluate tools based on total time saved, not just the monthly fee.

No comments yet. Be the first to share your thoughts!