Debugging tools budget
Choosing the right debugging environment depends on how much you are willing to spend and what hardware you already own. The market splits into free open-source utilities and paid IDEs that bundle AI assistance, performance profiling, and visual debugging interfaces.
Open-source options like WinDbg or GDB provide deep access to memory and process states without a license fee. These tools require command-line proficiency and manual setup, which can slow down quick reviews. They are ideal for system-level debugging where you need raw access to kernel dumps or low-level assembly.
Paid IDEs such as JetBrains Rider, Visual Studio Enterprise, or specialized AI-driven platforms like CodeRabbit offer integrated workflows. You pay for convenience: visual memory viewers, one-click remote debugging, and automated code review suggestions. These subscriptions typically range from $20 to $50 per month per seat.
Consider your team size and project complexity. For small scripts, a free CLI debugger is sufficient. For large-scale distributed systems, the time saved by paid AI-assisted debugging often justifies the monthly cost. Always check if your existing IDE supports plugins that add similar features for a lower price.



As an Amazon Associate, we may earn from qualifying purchases.
Shortlist real options
Choosing a debugging tool means balancing language support, integration depth, and cost. The following comparison highlights four widely used options that cover most modern workflows. Visual Studio Code and Chrome DevTools serve as free, versatile entry points, while PyCharm offers strong Python-specific automation. For low-level systems work, WinDbg remains the standard for Windows kernel and driver debugging.
Visual Studio Code dominates the general-purpose space because of its lightweight architecture and vast extension marketplace. You can attach debuggers for Python, JavaScript, Go, and C++ without leaving the interface. The integrated terminal and source control make it a strong all-in-one choice for most full-stack developers.
Chrome DevTools remains essential for frontend work. Its Network and Performance tabs provide visibility into loading times and memory leaks that IDEs often miss. While it lacks deep backend debugging, it is the fastest way to inspect live DOM changes and CSS rendering issues.
PyCharm’s debugger is designed specifically for Python’s complexity. It handles virtual environments, package dependencies, and data visualization out of the box. The free Community edition covers most needs, while the Professional tier adds database tools and web framework support for Django or Flask projects.
WinDbg is the go-to tool for Windows-specific development. It excels at analyzing memory dumps and debugging kernel-mode drivers. If you are working on system-level software or troubleshooting Blue Screen of Death (BSOD) errors, WinDbg provides the low-level access that higher-level IDEs cannot.


As an Amazon Associate, we may earn from qualifying purchases.
Inspect the expensive parts
Before you start guessing at the root cause, check the components most likely to fail. Debugging is often just a matter of verifying the expensive failure points first. This saves time by ruling out the obvious culprits before you dive into complex logic errors.
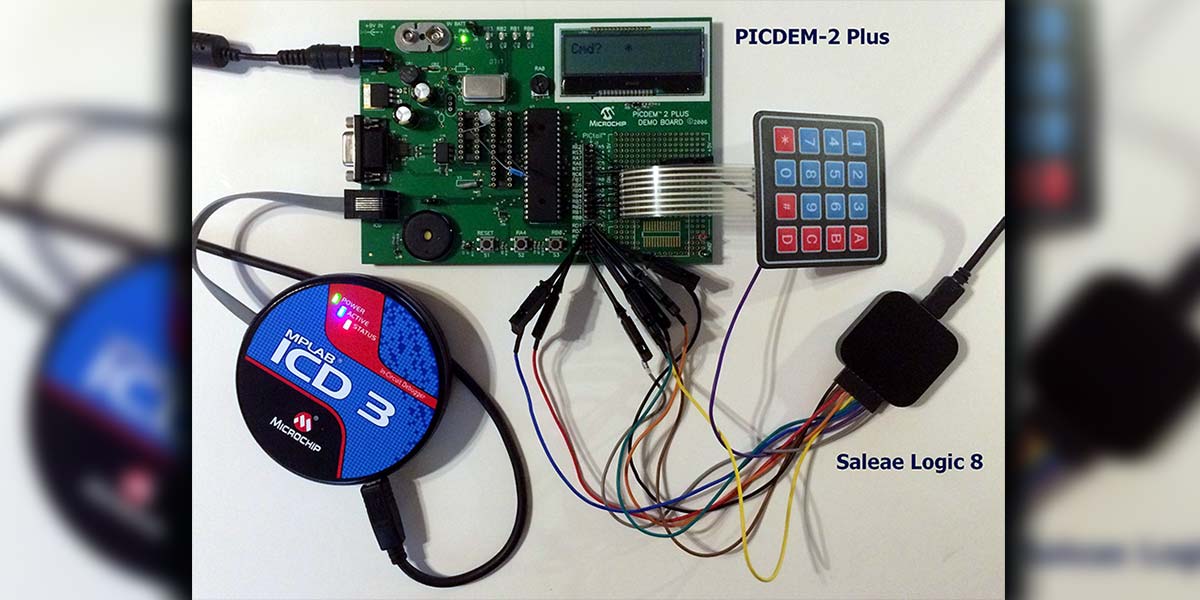
Start with the build log. Modern IDEs and compilers flag potential issues before you even run the code. Treat warnings as errors if possible. A clean build doesn't guarantee correctness, but a noisy build guarantees wasted time.

Mismatched environment variables are a silent killer. Check that your local .env files match the staging and production settings. Verify database connections, API keys, and feature flags. A single missing variable can crash an entire service.
Use git blame or your IDE's history view to see who changed a specific line and when. Look for recent commits that touch the failing module. Context matters: a change made yesterday is more likely to be the culprit than one from six months ago.

Strip away unrelated code until you have a minimal test case that still fails. This isolates the bug from the rest of the codebase. If the issue disappears when you remove a dependency, the problem lies in that interaction, not the core logic.
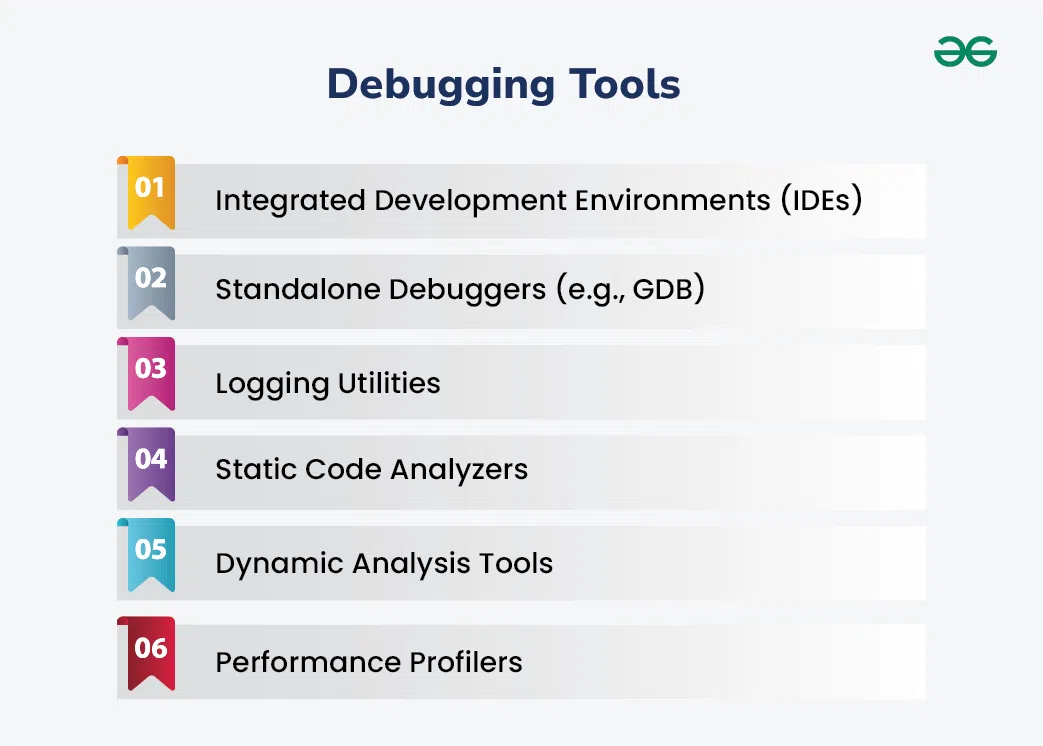
Assume external APIs are flaky. Check network logs and response codes. Are timeouts too short? Is the rate limit exceeded? A failing database query or a slow third-party service often looks like a bug in your application logic.
By systematically inspecting these high-risk areas, you move from random guessing to targeted investigation. This approach reduces noise and helps you find the root cause faster.
Plan for ownership costs
A free debugging tool is rarely free to run. The real cost isn't the download; it's the time your team spends managing updates, configuring integrations, and troubleshooting conflicts with existing workflows. When you evaluate AI-powered debugging tools, look past the initial price tag and calculate the total cost of ownership over a year.
Many AI tools promise to speed up code review, but they often require significant setup. You might need to configure API keys, train models on your specific codebase, or integrate with legacy systems that don't play nicely with modern AI plugins. These hidden steps can delay your timeline and drain engineering resources that could be spent on actual feature development.
Consider the maintenance burden. Does the tool require constant manual intervention to stay accurate? If your team spends more time correcting false positives from an AI debugger than they would have spent manually reviewing the code, the tool has failed. Choose solutions that offer out-of-the-box accuracy and minimal configuration to keep the ROI positive.



As an Amazon Associate, we may earn from qualifying purchases.
Debugging tools: what to check next
Choosing the right AI-powered debugging tool often comes down to matching the software to your specific stack and workflow. The following answers address common practical concerns about integrating these tools into your development environment.
No comments yet. Be the first to share your thoughts!