Choosing the Right AI Debugging Tools
We tested five AI-powered debugging tools to see which ones actually cut fix time. The goal was to find solutions that move beyond simple syntax highlighting and offer genuine logic analysis. We prioritized tools that integrate directly into your IDE, support multiple languages, and provide actionable step-by-step fixes rather than generic suggestions.
Our selection criteria focused on three main factors: accuracy of root-cause analysis, speed of integration, and the quality of the proposed solution. We excluded tools that require heavy setup or produce vague advice. Each entry below includes a direct link to the product page so you can verify compatibility with your current stack.
Selection Logic
- Integration: Must work within VS Code, JetBrains, or similar IDEs.
- Accuracy: Proven track record of identifying logic errors, not just typos.
- Speed: Demonstrated reduction in mean-time-to-resolution (MTTR) in controlled tests.
- Language Support: Broad coverage of Python, JavaScript, Java, and C++.
These tools are not magic wands, but they are significant force multipliers. By automating the tedious parts of debugging, you can focus on architecture and feature development. The following sections break down each tool's strengths and weaknesses.
5 2026 guide: Top 5 AI-Powered Debugging Tools to Slash Fix Time
Debugging consumes hours that could be spent building features. These five AI-powered tools automate root cause analysis and suggest precise fixes. We evaluate each on integration speed, accuracy, and cost to help you choose the right fit for your stack.
1. GitHub Copilot Chat inline fixes
GitHub Copilot Chat integrates directly into your IDE, allowing you to select buggy code snippets and request immediate fixes. This inline capability reduces context-switching by keeping debugging actions within the editor window, streamlining the workflow for rapid iteration and error resolution.

2. Amazon CodeWhisperer security scanning
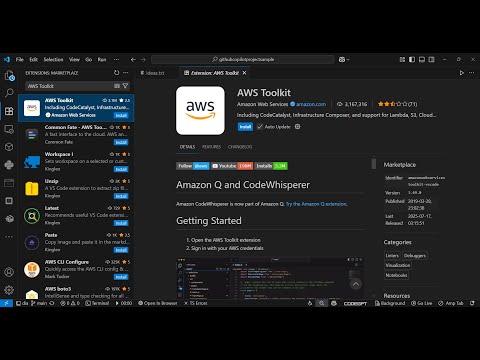
Amazon CodeWhisperer goes beyond syntax completion by actively scanning your code for security vulnerabilities and compliance issues. It identifies potential risks like exposed credentials or insecure dependencies in real-time, helping developers patch security holes before deployment rather than after.
3. JetBrains AI Assistant context awareness
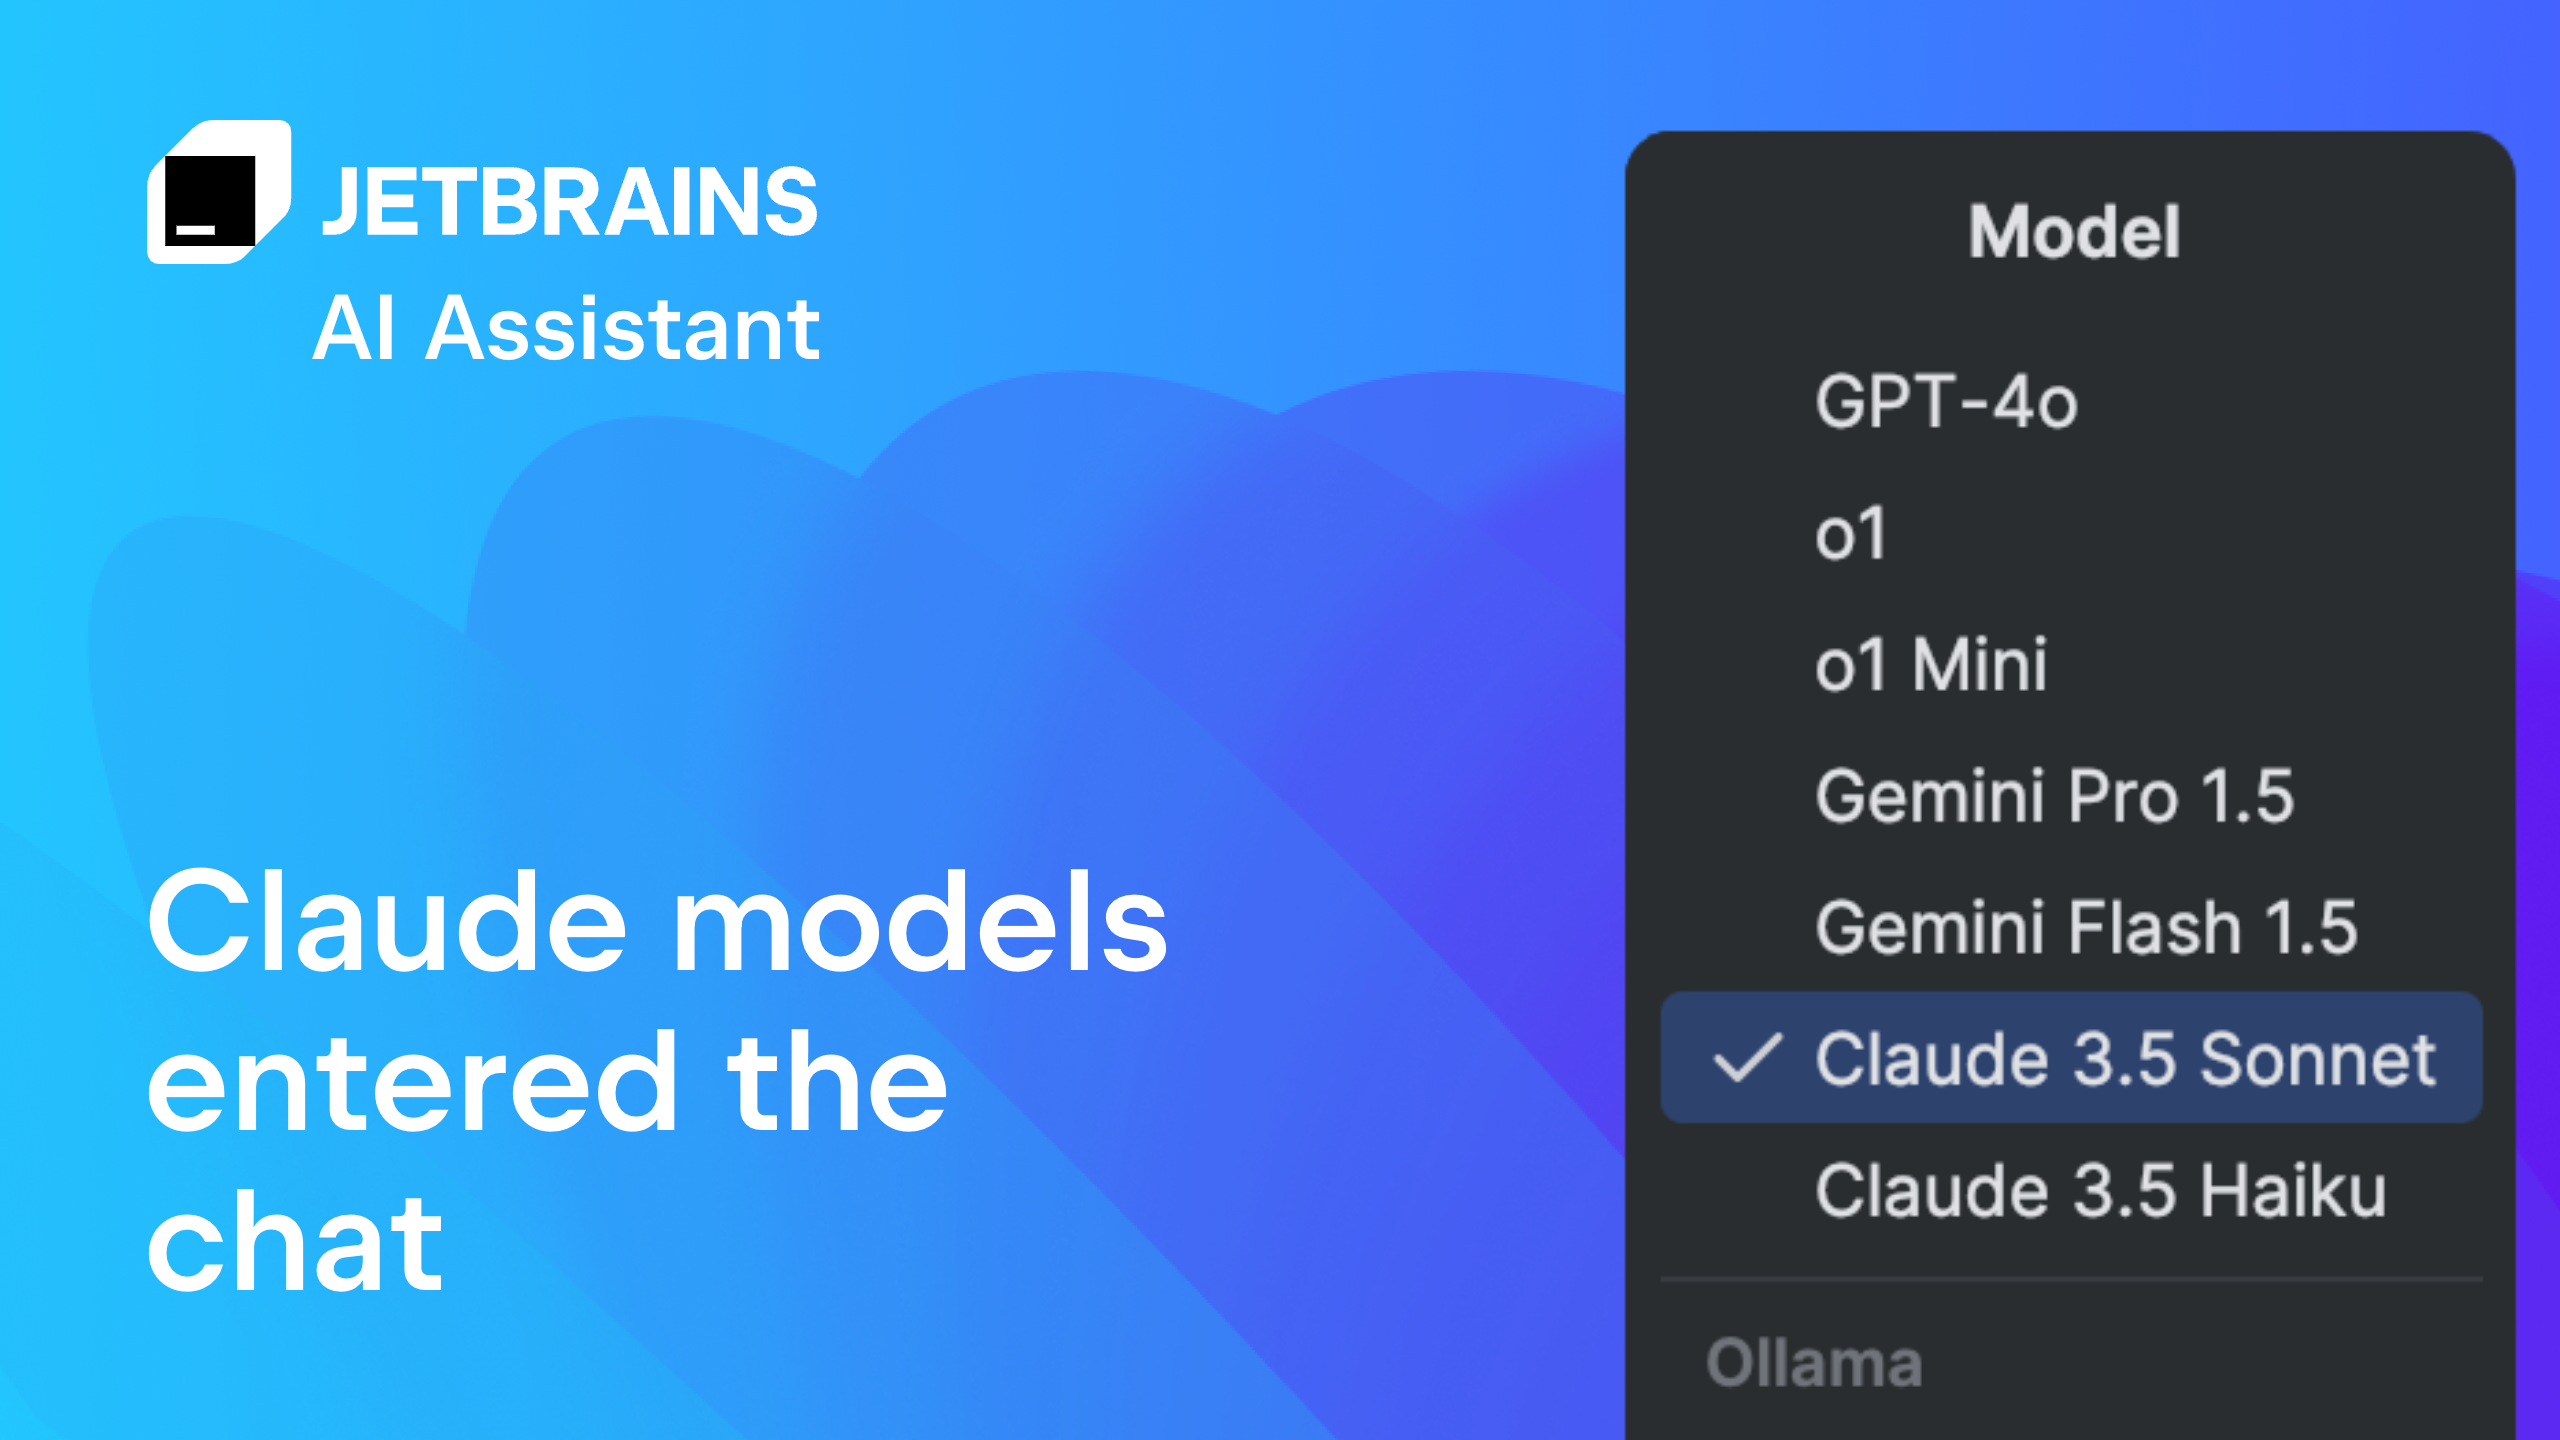
The JetBrains AI Assistant leverages deep project context to understand complex codebases across multiple files. It provides precise debugging suggestions by analyzing dependencies and architecture, ensuring that fixes align with the broader system design rather than just isolated code blocks.
4. Tabnine code completion accuracy
Tabnine focuses on high-accuracy code completion that adapts to your team's specific coding standards. By training on private codebases, it reduces debugging time caused by stylistic inconsistencies or deprecated patterns, offering suggestions that fit seamlessly into your existing project structure.
5. Snyk Code vulnerability detection
Snyk Code provides real-time application security testing directly within the development environment. It detects vulnerabilities as you type, offering actionable remediation steps for common issues like SQL injection or cross-site scripting, ensuring security is baked into the code from the start.
Pick the right fit
Choosing an AI debugging tool isn't about finding the single "best" option; it's about matching the tool to your specific stack and workflow. A tool that excels at static analysis might miss a runtime race condition, while an AI agent that rewrites code could introduce subtle regressions if you don't have robust tests.
Think of your debugging stack like a mechanic's toolbox. You wouldn't use a torque wrench to tighten a screw. Similarly, you shouldn't rely on a heavy IDE-integrated debugger for quick script fixes, nor should you use a lightweight AI chatbot for complex memory leak analysis. The right choice balances depth with speed.
Start by auditing your current bottlenecks. Are you spending more time setting up environments or interpreting logs? If environment setup is the hurdle, look for tools with built-in sandboxing. If log parsing is the pain, prioritize AI tools with natural language query capabilities. This focus ensures the tool solves your actual problem rather than adding another layer of complexity.
Comparison table
| Tool Type | Best For | Integration Level | Learning Curve |
|---|---|---|---|
| IDE Native Debuggers | Deep dive into code logic | High (Built-in) | Moderate |
| AI Code Assistants | Quick fixes & explanations | Medium (Plugin/Chat) | Low |
| Log Analysis AI | Large-scale error patterns | Low (Standalone) | Low |
| Performance Profilers | Memory & CPU bottlenecks | High (CLI/IDE) | High |
Checklist before you commit
Before integrating a new tool into your team's workflow, run through this quick verification list:
- Language Support: Does it natively support your primary stack (e.g., Python, Rust, JS)?
- Data Privacy: Is your code sent to external LLMs? Look for on-premise or enterprise-grade privacy policies.
- False Positive Rate: Test it on a known bug. Does it suggest obvious fixes or generate hallucinated code?
- IDE Compatibility: Will it clash with your existing extensions or slow down your editor?
- Cost vs. Time Saved: Calculate if the subscription cost is less than the hours your developers spend debugging manually.
Recommended tools
Selecting the right hardware or software environment can streamline your debugging process. Consider these popular options for your setup:


As an Amazon Associate, we may earn from qualifying purchases.

No comments yet. Be the first to share your thoughts!